You can not select more than 25 topics
Topics must start with a letter or number, can include dashes ('-') and can be up to 35 characters long.
1.1 KiB
1.1 KiB
4.1.6:手动创建子图
plt.axes创建子图
前面已经介绍过plt.axes函数,这个函数默认配置是创建一个标准的坐标轴,填满整张图。它还有一个可选的参数,由图形坐标系统的四个值构成。这四个值表示为坐标系的[底坐标、左坐标、宽度、高度],数值的取值范围为左下角为0,右上角为1。
下面演示在右上角创建一个画中画:
x1 = plt.axes() # 默认坐标轴
ax2 = plt.axes([0.65, 0.65, 0.2, 0.2])
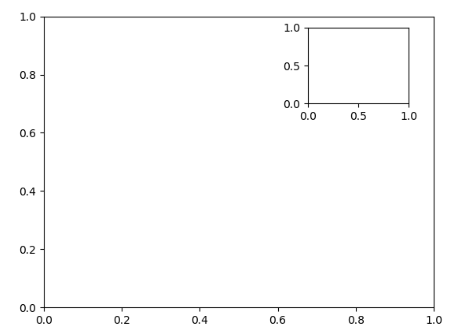
fig.add_axes()创建子图
面向对象画图接口中类似的命令由fig.add_axes()。用这个命令创建两个竖直排列的坐标轴:
fig = plt.figure()
ax1 = fig.add_axes([0.1, 0.5, 0.8, 0.4],
xticklabels=[], ylim=(-1.2, 1.2))
ax2 = fig.add_axes([0.1, 0.1, 0.8, 0.4],
ylim=(-1.2, 1.2))
x = np.linspace(0, 10)
ax1.plot(np.sin(x))
ax2.plot(np.cos(x))

可以看到两个紧挨着的坐标轴:上子图的(起点y坐标为0.5位置)与下子图x轴刻度是对应的(起点 y 坐标为 0.1,高度为 0.4)。