|
|
1 day ago | |
|---|---|---|
| branding | 3 weeks ago | |
| public | 3 weeks ago | |
| src | 1 day ago | |
| .gitignore | 3 weeks ago | |
| .gitpod.yml | 3 weeks ago | |
| CODE_OF_CONDUCT.md | 3 weeks ago | |
| CONTRIBUTING.md | 3 weeks ago | |
| LICENSE | 3 weeks ago | |
| README.md | 3 weeks ago | |
| jsconfig.json | 3 weeks ago | |
| package-lock.json | 3 weeks ago | |
| package.json | 3 weeks ago | |
| yarn.lock | 3 weeks ago | |
README.md
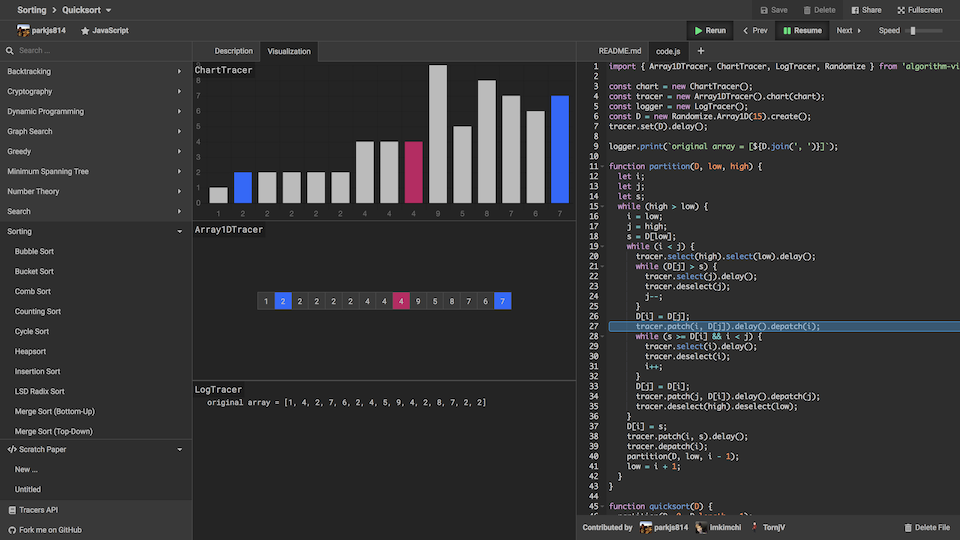
Algorithm Visualizer
Introduction
Welcome to Algorithm Visualizer, an interactive online platform designed to bring algorithms to life through visualization. Whether you're a student, teacher, or professional, our platform provides an engaging way to explore and understand various algorithms.


Languages and Frameworks Used
Key Features
-
Visualize algorithms from code:
Algorithm Visualizer allows you to witness algorithms in action by visualizing code written in various programming languages. This visual approach facilitates a better understanding of algorithmic behavior..
-
Learn about Algorithms:
Explore our collection of tutorials, articles, and videos that serve as valuable resources for learning about algorithms.
algorithms
In this repository, you'll find visualizations of algorithms showcased in the website's side menu. Contributions here directly impact the educational content available on the platform. https://github.com/algorithm-visualizer/algorithms
tracers
Explore the various visualization libraries in different programming languages. These libraries extract visualization commands from code. https://github.com/search?q=topic%3Avisualization-library+org%3Aalgorithm-visualizer&type=Repositories
Live Demo
Learning an algorithm gets much easier with visualizing it. Don't get what we mean? Check it out:
Contributing
Our project consists of multiple repositories, each playing a crucial role in the Algorithm Visualizer ecosystem. If you're interested in contributing, check out the guidelines for the specific repository:
-
algorithm-visualizeris a web app written in React. It contains UI components and interprets commands into visualizations. Check out the contributing guidelines. -
serverserves the web app and provides APIs that it needs on the fly. (e.g., GitHub sign in, compiling/running code, etc.) -
algorithmscontains visualizations of algorithms shown on the side menu of the website. -
tracers.*are visualization libraries written in each supported language. They extract visualizing commands from code.
Ready to contribute? Explore the repositories and become part of the Algorithm Visualizer community!